


Newsletter
Data shows that houses reign supreme throughout chaos
Events in the property market last year were interesting, to say the least. The country saw huge property price increases, tighter lending restrictions and migration out of metropolitan areas.
At BMT we love data and often look at key metrics and patterns, especially during challenging times. We analysed tax depreciation schedules prepared in 2021, to identify what the typical residential investment property looked like during this chaotic year. That is, the most common residential investment property type, where it is most often found, and how much investors have paid for it.
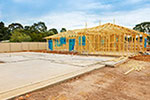
Investment property type
Based on the number of tax depreciation schedules BMT completed, houses remained the most popular investment property type during the second year of the pandemic. From 1 January 2021 to 31 December 2021, houses accounted for 55.1 per cent of our schedules and units 44.9 per cent. This is an increase of 3.8 per cent since calendar year 2019, the year prior to the pandemic.
| House vs unit tax depreciation schedules ordered | |||
| Property type | 2019 | 2020 | 2021 |
| House | 51.3% | 52.9% | 55.1% |
| Units | 48.7% | 47.1% | 44.9% |
Factors like reduced student immigration to Australia, a series of structural defects found in high rise residential projects, and the fear of being locked down during the pandemic in an apartment, could all be contributing to a shift of demand to houses, which we are now seeing flow through to property investors.
Investment property location
The ‘internal migration’ trend continued in 2021, with more people seeming to move from cities to regional areas. The number of depreciation schedules ordered for metropolitan regions has fallen by 5.7 per cent since 2019. Will this trend continue in 2022? We’ll have to wait and see.
| Metropolitan vs regional tax depreciation schedules ordered | |||
| 2019 | 2020 | 2021 | |
| Metro | 73.1% | 69.1% | 67.4% |
| Regional | 26.9% | 30.9% | 32.6% |
How much investors have paid
At the end of December 2021, Australian dwelling values across all properties were 22.1% higher than in December 2020. Australia’s inflated housing market is now valued at more than $9 trillion, a record high after surging home prices through the pandemic lifted the value of residential property by $1 trillion in the last six months of the year alone.
The tax depreciation schedules BMT prepared provide insight on the average purchase price of investment properties. The following table highlights the difference between average dwelling price across the country comparing BMT and ABS data for all dwellings over the same period (2021 year end).
| Average investment property vs Australian average dwelling price | ||
| Investment Property ($'000) |
Australian Average ($'000) |
|
| ACT | $514.0 | $949.7 |
| NSW | $768.7 | $1118.2 |
| NT | $445.1 | $479.9 |
| QLD | $523.3 | $681.0 |
| SA | $438.0 | $576.8 |
| TAS | $404.0 | $616.5 |
| VIC | $597.6 | $920.8 |
| WA | $502.3 | $597.1 |
| Total | $524.2 | $863.7 |
BMT Tax Depreciation can provide schedules on all types and sizes of properties, contact the team on 1300 728 726.